


Authors:
Jenny L Patterson1, J. Bruce Barber2, Daniel W. O’Connor3 and Samia R Toukhsati4*
1School of Psychology and Psychiatry, Monash University, Clayton, VIC 3800, Australia
2National Ageing Research Institute, Parkville, VIC 3052, Australia
3Institute for Health and Ageing, Australian Catholic University, Melbourne, VIC 3000, Australia
4University of Melbourne and Department of Cardiology, Austin Health, Heidelberg, VIC 3084, Australia
Received: 26 April, 2016; Accepted: 21 July, 2016; Published: 23 July, 2016
Samia Rachael Toukhsati , University of Melbourne, Department of Cardiology, Austin Health, Heidelberg, 3084 Victoria, Australia, Tel: +61 3 9496 3209; Fax: +61 3 9496 5026; E-mail:
Patterson JL, Barber JB, O’Connor DW, Toukhsati SR (2016) Electrophysiological Profiling of Depression in the Elderly. Arch Depress Anxiety 2(1): 031-036. DOI: 10.17352/2455-5460.000012
© 2016 Patterson JL, et al. This is an open-access article distributed under the terms of the Creative Commons Attribution License, which permits unrestricted use, distribution, and reproduction in any medium, provided the original author and source are credited.
Frontostriatal system functioning has been proposed to underpin performance on executive functioning tasks; these structures are abnormally activated in adults with depression. In this study, the P200 and P300 event-related potentials (ERPs) were elicited during a classic two-tone auditory oddball task to compare the electrophysiological profiles of elderly people (N = 54; Mean age = 85.46 ± 6.21) diagnosed with clinical depression (n = 17), subthreshold depression (n = 25) or no depression (n = 12). The P200 results revealed higher amplitude and significantly longer latencies in depressed groups relative to non-depressed participants. Higher P300 amplitude, but shorter latencies, were observed in depressed relative to non-depressed participants. Findings are discussed in terms of cognitive information processing models of ERPs and the potential for non-cognitive factors to impact on the resulting electrophysiological profile.
Introduction
Executive functioning is impaired in the setting of depression [1]. Frontostriatal system functioning has been proposed to underpin performance on executive functioning tasks and research has shown that these structures are abnormally activated in adults with depression [2-4]. These structures have also been implicated in generating the P200 and P300 event-related potentials (ERPs), which provide an electrophysiological index of cognitive functioning. Corresponding with the known disruption to executive functioning in depressed cohorts, research amongst young adults with depression has tended to reveal lower P300 amplitude relative to their non-depressed counterparts [5-8]. The research is less consistent with regard to latency; however, prolonged latency has been observed in specific subtypes of depression in which psychomotor retardation is a prominent feature [6].
Collectively, ERP and neuropsychological data appear to provide converging evidence of prefrontal dysfunction in depression amongst young cohorts; however, little research has utilized electrophysiological methods to explore cognitive dysfunction arising in the context of depression amongst the elderly. Early reports found no significant differences in P300 latency for depressed elderly [9-12], however, these studies tended to be poorly controlled with regard to stimulus (i.e., probability, inter-stimulus interval) and sample (i.e., age, medication status) variables. More recent findings from studies that control for such factors have revealed prolonged P300 latency amongst depressed elderly relative to their age-matched, non-depressed counterparts [13-15]. Moreover, such abnormalities have been associated with poorer performance on tasks of executive functioning, psychomotor retardation and poorer treatment response [13,14].
Presently, the influence of depression on ERP amplitude in the elderly is largely unknown. This is notable because it is the most consistent cognitive marker of depression in younger cohorts [6]. As a general principle, age-related structural changes in the brain and other physiological factors have been shown to produce differences in ERPs between young and older adults. Indeed, research has revealed differences in the spatial distribution of ERP components, temporal properties (i.e., lower amplitude and longer latency in the elderly), as well as a general increase in the degree of individual ERP variability in older cohorts [16]. For example, elderly samples typically demonstrate a more ‘U-shaped’ P300 spatial distribution, with higher amplitude at the frontal and posterior sites, as opposed to the singular maximal posterior P300 distribution seen in younger samples [17]. Such differences in ERPs between young and old suggest that the characterization of ERPs in elderly with and without depression is an important area of inquiry.
From a cognitive perspective, the high temporal resolution of ERPs means that this technique has the potential to provide important information about the stage of information processing that may be disrupted in elderly with depression. To date, the limited available data has revealed significant increases in P200 amplitude, consistent with over-processing of irrelevant stimuli, which may explain downstream P300 abnormalities [18,19]. Further research that examines early ERP components will provide a more comprehensive insight into the electrophysiological profile of geriatric depression. To this end, the aim of this study was to explore the electrophysiological profile of elderly individuals with varying severity of depression, with a specific focus on latency and amplitude of the P200 and P300 auditory ERPs.
Method
Participants
Following ethics approval by the Monash University Human Research Ethics Committee (Project number CF07/4928 – 2007002107), participants were recruited from 15 Residential Aged Care facilities (RACFs) in Melbourne, Australia. Exclusion criteria were (1) a formal diagnosis of dementia or delirium; (2) legal blindness; (3) deafness or severe hearing impairment; (4) lack of English fluency. Participants were screened using the Standardized Mini-Mental State Examination (SMMSE) and the Geriatric Depression Scale (GDS-15). To account for lowered scores on the SMMSE due to depression, individuals with scores of 20-24 were retained for preliminary analyses. Individuals with SMMSE scores below 20 were excluded from further participation in the study (n = 33). This yielded a total sample of 73 participants. Depression was diagnosed using the Depression module from the non-patient version of the Structured Clinical Interview for the DSM-IV-TR (SCID-I). Participants were grouped according to their severity of depression: non-depressed was defined as no SCID-I diagnosis of depression and a Geriatric Depression Scale – 15 (GDS-15) score < 2 (n=12); subthreshold depression was defined as no SCID-I diagnosis of depression and a score of 2 or more on the GDS-15 (n=25); and clinical depression was defined a SCID-I diagnosis of major or minor depression (n=17).
Post-hoc exclusion criteria excluded 11 participants on the basis of biological factors (for example, a history of neurological disease or left handedness); 4 participants were excluded due to having fewer than 20 (out of a possible 60) artifact-free ERP trials [20]; and finally, data from 4 participants was removed at the data cleaning stage due to being classified as outliers. Following these exclusions, a total of 54 participants were included in the final analysis.
Materials
SCID-I
A diagnosis of major or minor depression was made using a semi-structured clinical interview schedule which is based on criteria outlined for Axis I disorders in the DSM-IV-TR [21]. This tool is considered the gold-standard for diagnosis of mental illness and has been extensively used in both clinical and research settings [22]. In terms of validity, the SCID-I has been shown to be superior to standard clinical interviews [23].
GDS-15
Depressive symptoms were assessed using the 15-item Geriatric Depression Scale [24,25], (GDS-15), which is the most widely used screening measure for depression among the elderly [25]. This test utilizes a dichotomous response format whereby participants are required to respond with a ‘yes’ or ‘no’ as to whether they have experienced a given symptom in the two weeks prior to assessment. One-point is scored for each item in which a symptom is endorsed, with higher scores indicative of a greater likelihood of a depressive illness. Examples of items included are “Have you dropped many of your activities and interests?”, “Do you feel that your life is empty?” and “Do you experience any feelings of worthlessness right now?”
SMMSE
General cognition was measured using the Standardized Mini-Mental State Examination [26,27] (SMMSE), which is a variation of the widely used original MMSE cognitive screening test. It comprises the same 30 items included in the MMSE which broadly assess orientation, attention and calculation, immediate and short-term recall, language and the ability to follow basic written and verbal commands. The standardized version of the MMSE provides expanded guidelines for administration (such as time limits for responding) and scoring (such as stricter guidelines for scoring near misses on items). The use of the expanded guidelines has been shown to improve reliability (0.69 for the original MMSE versus 0.90 for the standardized version) [27], and decrease testing time relative to the original version of the MMSE.
Electrophysiological testing
Electroencephalogram (EEG) testing was conducted with the use of a portable 40-channel NuAmps amplifier and Scan 4.3 Acquisition software was used to acquire EEG data in a single continuous file from which P200 and P300 ERP data were later extracted offline. In accordance with the NuAmps International 10-20 system, scalp EEG was recorded from 16 lateral, homologous pairs of electrodes (FP1/2, F7/8, F3/4, FC3/4, T3/4, C3/4, CP3/4, T5/6, P3/4, O1/2) and 6 midline electrodes (Fz, FCz, Cz, CPz, Pz, Oz) using a QuikCap with sintered Ag/AgCl electrodes and a linked ears (A1, A2) reference. Electrodes at supra- and infra-orbital sites surrounding the left eye were used to record blinks and vertical eye movements (bipolar), and right and left outer canthi electrodes were used to monitor horizontal eye movements (bipolar). Impedances were generally maintained below 5 kΩ [28].
ERPs were elicited using the classic two-tone auditory oddball paradigm (Kemp et al., 2009). In this task participants were presented with a series of ‘non-target’ or standard tones (500Hz) that are randomly interspersed with ‘target tones’ (1000Hz). Target probability was set at approximately 20%, consistent with past research [18,29]. As such, there were a total of 280 non-target tones and 60 target tones, with each tone lasting a total of 50ms, and an inter-stimulus interval of one second. Tones were set at a comfortable sound pressure level.
The Compumedics Neuroscan EDIT program version 4.4 was used to filter raw EEG data using a low pass, zero-phase shift filter set at 30Hz (24dB). Electrooculogram (EOG) corrections were conducted offline whereby a positive threshold of 10%, with a minimum of 20 sweeps and duration of 400ms, was applied to the data with the vertical EOG labelled as the blink channel. Epochs from -200 to 700ms were created and any that were found to overlap rejected blocks were discarded at this stage. Baseline correction was applied for all electrodes, with artefacts with voltages in excess of +/-100µVs rejected.
Upon completion of data extraction and correction procedures, P200 and P300 ERP data were extracted from EEG recordings. A single averaged waveform associated with target and non-target stimuli was extracted for each recording site using the Average procedure in Scan 4.4. Peaks were then identified using the Peak Detection procedure with the peak window set at 140-270ms for the P200 and 270 ms to 550 ms for the P300 (relative to the stimulus onset) [18].
Procedure
Testing was conducted in private and participants were comfortably seated directly in front of a laptop used to present the auditory stimulus. The distance from the participant’s nasion to the inion was measured and the EEG QuikCap was then placed on the participants head so that the FP1 electrode was positioned approximately 10% of this distance. A water-based gel was injected into each electrode site using a blunt syringe.
Following set-up, the oddball task was explained to the participant and they completed a one-minute practice trial. Participants were instructed to ignore the non-target tones and to respond to the target tones by pressing a labelled button on the laptop directly in front of them. A small cross appeared on the laptop screen and participants were instructed to focus on this during trials to minimize eye movements. Following the practice session, participants completed four oddball trials, each lasting a total of two minutes, with two minute resting trials (eyes open and eyes closed) interspersed between each oddball trial, yielding a total EEG testing time of approximately 16 minutes.
Results
Demographics
Participant demographic and affective indices are presented in Table 1.
As can be seen in Table 1, there were no significant differences in the ratio of males to females, age, medication usage, caffeine consumption, total years of education and SMMSE scores across the three participant groups. As expected, participants with no depression, subthreshold depression and clinical depression each differed significantly on the GDS-15.
ERP Behavioural data
The means and standard deviations for reaction time and accuracy of participants in identifying the target odd-ball tones when eliciting the ERPs are presented in Table 2.
-
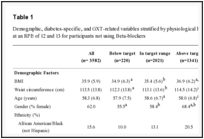
Table 2:
Means (M) and standard deviations (SD) for ERP reaction time and accuracy by depression status.
Table 2 reveals that participants with no depression responded faster to the target tones on the oddball task compared to participants with depression. A similar level of accuracy was achieved by all groups identifying the target tones. ANCOVAs with anti-depressant medication (ADM) and central nervous system medication (CNSM) held constant revealed no significant differences in reaction time or accuracy between groups. Grand average event-related potentials for P300 at the Pz site are provided in Figure 1 to illustrate the different wave forms elicited for the non-target and target tones for non-depressed (n = 12), subthreshold (n=25) and clinically depressed (n=17) groups.
-

Figure 1:
Standard versus target tones for each depression classification.
P200 amplitude and latency
P200 means and standard deviations for amplitude and latency at midline sites (Fz, Cz, Pz) are presented in Table 3.
-
Table 3:
Means (M) and standard deviations (SD) for P200 amplitude and latency at the Fz, Cz and Pz sites by depression status.
As can be seen in Table 3, there is a consistent trend towards higher amplitude and progressively longer latencies at all sites with increasing depression severity, with amplitude and latency of the subthreshold group consistently falling between participants with non-depressed and clinically depressed participants. Examination of within group variation in amplitude across the three midline sites reveals the classic ‘U-shaped’ pattern typically observed among elderly for non-depressed and subthreshold depression, but not for those identified as clinically depressed. That is, participants with no depression and subthreshold depression had higher amplitudes at Fz and Pz, with a decrease in Cz amplitude. In contrast, an anterior shift was apparent in clinical depression, with higher amplitudes evident at the Fz and Cz sites and decreased amplitude at Pz.
Preliminary checks for Fz, Cz and Pz amplitude and Fz, Cz and Pz latency indicated no violations of normality, linearity, homogeneity of variances or homogeneity of regression slopes. In a series of nested ANCOVAs that controlled for age, CNSM, ADM and past psychiatric admission history, a significant difference between groups was detected for Fz latency (F (2, 20) = 5.34, p < 0.01, η2=.35), Cz latency (F (2, 20) = 4.54, p < 0.05, η2=.31), and Pz latency (F (2, 20) = 6.30, p < 0.01, η2=.39). Across each of the three electrode sites, post hoc pairwise comparisons revealed that Fz, Cz and Pz latency were all significantly shorter for the non-depressed group relative to clinically depressed participants (p < 0.05). No significant differences between the non-depressed and the subthreshold groups were observed. No significant differences were identified between groups in P200 amplitude.
P300 amplitude and latency
P300 means and standard deviations for amplitude and latency at midline sites (Fz, Cz, Pz) are presented in Table 4.
-
Table 4:
Means (M) and standard deviations (SD) forP300 amplitude and latency at the Fz, Cz and Pz sites by depression status.
Table 4 reveals that P300 amplitude was consistently higher for the depressed groups compared to the no depression group. In contrast, longer latencies were observed at all sites in non-depressed relative to the depressed groups. Consistent with the P200, the scalp distribution of the P300 amplitude for non-depression and subthreshold depression followed the ‘U-shaped’ pattern typical of elderly ERPs. In contrast, higher levels of central and frontal activation were apparent in the clinically depressed group.
Preliminary checks revealed no violations of normality, linearity, homogeneity of variances or homogeneity of regression slopes for any of the P300 variables. In a series of nested ANCOVAs, no significant differences were observed between the groups with regard to amplitude data at each of the three electrode sites. Only Pz latency was found to be significantly different after controlling for age, CNSM, ADM and past psychiatric admission history (F (2, 20) = 8.35, p < 0.01, η2=.46). Examination of the adjusted means revealed that subthreshold depression was associated with the shortest latency (M=351.36), followed by clinical depression (M=419.68), and finally, no depression (M=480.47). Post hoc pairwise comparisons revealed that Pz latency was significantly shorter for the subthreshold group relative to non-depressed (p < 0.01) and clinically depressed participants (p = 0.05). No significant difference between non-depressed and clinically depressed was observed.
Relationship between ERPs and depression
Pearson’s correlation coefficients between ERP variables and GDS-15 scores are presented in Table 5.
-
Table 5:
Pearson’s correlation coefficients for P200 and P300 ERP variables and the GDS-15.
As can be seen in Table 5, with the exception of Fz and Pz amplitude, all of the P200 ERP variables were significantly positively correlated with the GDS-15, suggesting that higher levels of depression were associated with higher P200 Cz amplitude and longer latency at all three latency sites. All correlations between the GDS-15 and P300 amplitude variables were positive, suggesting that higher levels of depression were associated with higher amplitude; however, only the correlation between Cz amplitude and the GDS-15 was significant. All correlations between the GDS-15 and P300 latency were negative, indicating that higher levels of depression were associated with shorter latency; however, the relationship was once again only significant at the Cz site.
Discussion
The aim of this study was to provide an electrophysiological profile of elderly with depression. The key findings were as follows: 1) non-significant trends indicated slower reaction time and lower accuracy amongst depressed participants; 2) trends for both the P200 and P300 indicated higher amplitude at each electrode site among depressed participants; 3) in relation to latency, the pattern of findings indicated longer P200, but shorter P300, latency for the depressed group relative to the non-depressed; 4) amongst the depressed group, a more fronto-central distribution was evident, rather than the classic ‘U-shaped’ distribution characteristic of elderly samples. Each of these key findings are discussed below.
Examination of the behavioural data indicated a trend towards longer reaction times for the depressed groups; however, the differences failed to reach statistical significance. Likewise, no differences were observed in the accuracy of target identification across all three groups. Although some studies have observed statistically significant differences in reaction times amongst young adults with depression relative to individuals with subthreshold and no depression [18], other research in younger cohorts with depression has reported equivalence in behavioural performance [30,31]. It is possible that studies that have observed prolonged reaction times in depressed participants may have had higher numbers of participants experiencing psychomotor retardation as part of their symptom profile. Unfortunately, too few participants presented with melancholic depression (for which psychomotor retardation is a core feature) to enable examination of this possibility in the current sample. Importantly, the absence of a difference in reaction times does not preclude the possibility of observing differences in the latency ERPs, given that latency is related to the speed of cognitive processing of information prior to the response being made. That is, latency represents the time taken to determine if a response is required, as opposed to reaction time, which provides a measure of the time taken to press the button [29].
Examination of P200 amplitude and latency data revealed that participants with depression had higher amplitude and significantly longer latencies relative to non-depressed participants. These findings are consistent with those reported by Kemp and colleagues amongst younger adults with depression. Kemp et al. [18] suggested that increased P200 amplitude may represent an over-processing, or lack of inhibition, of irrelevant stimuli. Increased P200 amplitude has been proposed to have a downstream influence on P300 processing through reduced amplitude and increased latency in depressed cohorts [18]. However, in the current study, non-significant trends in the P300 data revealed increased amplitude and decreased latency amongst participants with depression relative to non-depressed participants. Given that these findings counter the predominant cognitive interpretation of the P300, in which poorer cognitive functioning is presumed to be associated with decreased amplitude and increased latency of the P300, replication is important. While unexpected, the P300 latency findings observed here are nonetheless consistent with other studies that have reported 1) no significant differences between depressed and non-depressed elderly, and 2) non-significant trends to indicate that P300 latency was shorter in depressed compared to non-depressed elderly [9-12].
Further to this last point, other research has emphasized interpretations of ERPs that focus on the impact of non-cognitive factors on amplitude and latency of ERPs. For example, Pierson and colleagues [32], observed increased P300 amplitude amongst individuals with higher levels of anxious agitation compared to retarded-blunted affect. Although these specific dimensions were not examined in the current study, levels of anxiety were significantly higher amongst the depressed groups relative to the non-depressed. As such, higher levels of anxiety, in addition to possible age-related changes in brain function, may explain the higher amplitude of the P300 amongst the current sample and highlight the need for further research in elderly depressed samples. More recent research has suggested that ERP abnormalities may be related to specific symptoms of depression (i.e., melancholic, psychotic or anhedonic symptoms) than the diagnostic category as a whole, which encompasses a broad array of symptom profiles [6,33]. Unfortunately, sufficient numbers of participants with subtypes of depression were not recruited in the current study and so comparisons of such factors were not possible; however, future research may benefit from a applying a more symptom-based classification of participants.
A final explanation of the finding that the depressed group presented with higher amplitude and shorter latency of the P300 than non-depressed groups, albeit non-significantly, pertains to the peak amplitude procedure used here. In this regard, it is possible that the peak detection procedure may have captured the earlier subcomponent of the P300, P3a, for some participants and the later P3b component (the classic ‘P300’) for others as a function of their cognitive (and depressive) status. The P3a differs in several respects to the classic P300 in that it has a shorter latency, higher amplitude and has a more fronto-central distribution relative to the P3b [34,35]. Polich [36], reported that only 10-20% of the population may exhibit a ‘bifurcated’, or two-peak, P300 component; however, use of a more cognitively challenging paradigm increases the likelihood of observing the P3a subcomponent. In young adult samples, more complex paradigms that include a novelty tone in addition to the standard and target tones used on the classic oddball paradigm, have conventionally been used to elicit the P3a [30]. Given the cognitive impairment identified in the depressed sample in the current study, it could be speculated that the simple two-tone oddball paradigm was sufficiently taxing to elicit a clear P3a component for some or all of the depressed participants. Indeed, the pattern of results for this group – higher amplitude and shorter latency relative to the non-depressed, as well as the more fronto-central distribution - was more consistent with the elicitation of a P3a than a P3b component. Moreover, the consistency of the current findings for P200 with previous literature examining the P200, suggests that the problem was confined to the P300 component. More broadly, the difficulty in distinguishing the P3a and P3b may account for reports of increased latency variability in elderly samples and inconsistencies observed in past research in depressed elderly samples. To this end, future research should include both novel and simple oddball paradigms to assess the likelihood that a P3a and/or P3b will be elicited in a depressed sample.
Conclusion
In summary, the P200 findings in the current study confirmed past research, with higher amplitude and significantly longer latency observed in depressed groups relative to non-depressed. In contrast, P300 findings showed that depressed participants tended to exhibit lower amplitudes and shorter latencies. Methodological issues relating to stimulus parameters and control of confounding variables were unlikely to account for the unexpected findings. A plausible explanation for the findings may relate to the elicitation of an earlier P3a subcomponent in depressed participants and the P3b for other participants. Alternatively it is possible that non-cognitive factors, such as anxiety, may have impacted on the P300. To this end, future research would benefit from examining depression subtypes in elderly and/or utilizing a symptom-based classification system to explore symptoms that may influence ERP variables in greater detail.
-
- Castaneda AE, Tuulio-Henriksson A, Marttunen M, Suvisaari J, Lonnqvist J (2008) A review on cognitive impairments in depressive and anxiety disorders with a focus on young adults. J Affect Disord 106: 1-27 .
- Alexopoulos GS, Borson S, Cuthbert BN, Devanand DP, Mulsant BH, et al. (2002) Assessment of late life depression. Biol Psychiatry 52: 164-174 .
- Alexopouolos GS (2005) Depression in the elderly. Lancet 365: 1961-1970 .
- Sexton CE, McDermott L, Kalu UG, Hermann LL, Bradley KM, et al. (2012) Exploring the pattern and neural correlates of neuropsychological impairment in late-life depression. Psychol Med 42: 1195-202 .
- Anderer P, Saletu B, Semlitsch HV, Pascual-Marqui RD (2002) Perceptual and cognitive event-related potentials in neuropsychopharmacology: methodological aspects and clinical applications (pharmaco-ERP topography and tomography). Methods Find Exp Clin Pharmacol 121-137 .
- Bruder GE, Kayser J, Tenke C (2013) Event-related brain potentials in depression: clinical, cognitive and neurophysiologic implications. In Luck SJ, Kappenmann ES (Eds.), Event-related potential components: the ups and downs of brainwave recordings 563-592.
- Diner BC, Holcomb PJ, Dykman RA (1985) P300 in major depressive disorder. Psychiatry Res 15: 175-184 .
- Gangaghar B, Ancy J, Janakiramaiah N, Umapathy C (1993) P300 amplitude in non-bipolar, melancholic depression. J Affect Disord 28: 57-60 .
- Kraiuhin C, Gordon E, Coyle S, Sara G, Rennie C, et al. (1990) Normal latency of the P300 event-related potential in mild-to-moderate alzheimer's disease and depression. Biol Psychiatry 28: 372-386 .
- Patterson JV, Michalewski HJ, Starr A (1988) Latency variability of the components of auditory event-related potentials to infrequent stimuli in aging, Alzheimer-type dementia, and depression. Electroencephalogr Clin Neurophysiol 71: 450-460.
- Pfefferbaum A, Wenegrat B, Ford J, Roth W, Kopell B (1984) Clinical applications of the P3 component of event-related potentias. II. Dementia, depression and schizophrenia. Electroencephalogr Clin Neurophysiol 59: 104-124 .
- Sumi N, Nan'no H, Fujimoto O, Ohta Y, Takeda M (2000) Interpeak latency of auditory event-related potentials (P300) in senile depression and dementia of the Alzheimer type. Psychiatry Clin Neurosci 54: 679-684.
- Kalayam B, Alexopoulos GS (1999) Prefrontal dysfunction and treatment response in geriatric depression. Archives Gen Psychiatry 56: 713-718 .
- Kalayam B, Alexopoulos GS, Kindermann S, Kakuma T, Brown GG, et al. (1998) P300 latency in geriatric depression. Am J Psychiatry 155: 425-427 .
- Kindermann SS, Kalayam B, Brown GG, Burdick KE, Alexopoulos GS (2000) Executive functions and P300 latency in elderly depressed patients and control subjects. Am J Geriatr Psychiatry 8: 57-65 .
- Amenedo E, Díaz F (1998) Aging-related changes in processing of non-target and target stimuli during an auditory oddball task. Biol Psychol 48: 235-267 .
- Fabiani M, Friedman D, Cheng JC (1998) Individual differences in P3 scalp distribution in older adults, and their relationship to frontal lobe function. Psychophysiology 35: 698-708 .
- Kemp AH, Hopkinson PJ, Hermens DF, Rowe DL, Sumich AL, et al. (2009) Fronto-Temporal Alterations Within the First 200 ms During an Attentional Task Distinguish Major Depression, Non-Clinical Participants With Depressed Mood and Healthy Controls: A Potential Biomarker? Hum Brain Mapp 30: 602-614 .
- Kemp AH, Pe Benito L, Quintana DS, Clark CR, Mc Farlane A, et al. (2010) Impact of depression heterogeneity on attention: An auditory oddball event related potential study. J Affect Disord 123: 202-207 .
- Handy TC (Ed.) (2005) Event-related potentials: A methods handbook. Cambridge, MA: MIT Press.
- American Psychiatric Association (2013) Diagnostic and Statistical Manual of Mental Disorders, Fifth Edition. Washington, DC: Author.
- McCabe MP, George K, Moore K, Mellor D, Ski C, et al. (2004) Recognizing and screening for depression among older people living in residential care. Beyond Blue: the national depression initiative. Melbourne, Australia: Centre for Health Risk Behaviours and Mental Health: Deakin University .
- Basco MR, Bostic JQ, Davies D, Rush AJ, Witte B, et al. (2000) Methods to Improve Diagnostic Accuracy in a Community Mental Health Setting. Am J Psychiatry 157: 1599-1605 .
- Sheikh J, Yesavage J (1986) Geriatric Depression Scale (GDS): Recent evidence and development of a shorter version. Clinical Gerontologist: The Journal of Aging and Mental Health 5: 165-173 .
- Yesavage J, Brink TL, Rose TL, Lum O, Huang V, et al. (1983) Development and validation of a geriatric depressiopn screening scale: a preliminary report. Journal of Psychiatric Research 17: 37-49.
- Folstein MF, Folstein SE, McHugh PR (1975) Mini-mental state". A practical method for grading the cognitive state of patients for the clinician. J Psychiatr Res 12: 189-198 .
- Molloy DW, Alemayehu E, Roberts R (1991) Reliability of a Standaridized Mini-Mental State Examination compared with the traditional Mini-Mental State Examination. Am J Psychiatry 148: 102-105 .
- Spencer KM, Dien J, Donchin E (1999) A componential analysis of the ERP elicited by novel events using a dense electrode array. Psychophysiology 36: 409-414 .
- Polich J (1996) Meta-analysis of P300 normative aging studies. Psychophysiology 33: 334-353 .
- Bruder GE, Kroppmann CJ, Kayser J, Stewart JW, McGrath PJ, et al. (2009) Reduced brain responses to novel sounds in depression: P3 findings in a novelty oddball task. Psychiatry Research 170: 218-223 .
- Bruder GE, Tenke C, Towey JP, Leite P, Fong R, et al. (1998) Brain ERPs of depressed patients to complex tones in an oddball task: relation of reduced P3 asymmetry to physical anhedonia. Psychophysiology 35: 54-63 .
- Pierson A, Ragot R, Van Hooff J, Partiot A, Renault B, et al. (1996) Heterogeneity of information-processing alterations according to dimensions of depression: An event-related potentials study. Biol Psychiatry 40: 98-115 .
- lv J, Zhao L, Gong J, Chen C, Miao D (2010) Event-related potential based evidence of cognitive dysfunction in patients during the first episode of depression using a novelty oddball task. Psychiatry Research 182: 58-66 .
- Bruder GE, Tenke CE, Stewart JW, Towey JP, Leite P, et al. (1995) Brain event-related potentials to complex tones in depressed patients: relations to perceptual asymmetry and clinical features. Psychophysiology 32: 373-381 .
- Bruder GE, Towey JP, Stewart JW, Friedman D, Tenke C, et al. (1991) Event-related potentials in depression: influence of task, stimulus hemifield and clinical features on P3 latency. Biol Psychiatry 30: 233-246 .
- Polich J (1998) P300 clinical utility and control of variability. J Clin Neurophysiol 15: 14-33 .


Table 1:
Participant characteristics (M ± SD) by depression status.
(n=12)
(n=25)
(n= 17)
Male
Female
7 (58.30%)
14 (56.00%)
12 (70.60%)