


Authors:
László Makra1*, István Matyasovszky2, Beatrix Bálint3, Károly Bodnár1 and Gábor Tusnády4
1Institute of Economics and Rural Development, Faculty of Agriculture, University of Szeged, HU-6800 Hódmezővásárhely, Hungary
2Department of Meteorology, Eötvös Loránd University, HU-1117 Budapest, Hungary
3Hospital of Chest Diseases, Csongrád County, Alkotmány u. 36, H-6772 Deszk, Hungary
4Mathematical Institute of the Hungarian Academy of Sciences, HU-1364 Budapest, Hungary
Received: 01 June, 2015; Accepted: 10 June, 2015; Published: 12 June, 2015
László Makra, Institute of Economics and Rural Development, Faculty of Agriculture, 1Institute of Economics and Rural Development, Faculty of Agriculture, University of Szeged, H-6800 Hódmezővásárhely, Hungary, Tel: +36 62 532 990; Fax: +36 62 532 991; Email:
Makra L, Matyasovszky I, Bálint B, Bodnár K, Tusnády G (2015) Risk Factors for Asthma Hospitalization among Adults and Elderly. Arch Otolaryngol Rhinol 1(1): 012-022. DOI: 10.17352/2455-1759.000003
© 2015 Makra L, et al. This is an open-access article distributed under the terms of the Creative Commons Attribution License, which permits unrestricted use, distribution, and reproduction in any medium, provided the original author and source are credited.
Air pollution; Allergenic pollen; Asthma bronchiale; Emergency room (ER) visit; Patient number
Joint effect of biological (pollen) and chemical air pollutants on asthma emergency room (ER) visits was analyzed for Szeged region of Southern Hungary. Our database of a nine-year period (1999-2007) includes daily number of asthma emergency room (ER) visits, and daily mean concentrations of CO, PM10, NO, NO2, O3 and SO2, furthermore two pollen variables (Ambrosia and total pollen excluding Ambrosia), as well. The analysis was performed for ER visits of asthma bronchiale using two age groups (adults and the elderly) of males and females for three seasons. Factor analysis was performed in order to clarify the relative importance of the pollutant variables affecting asthma ER visits. Asthma ER visits denote notably stronger associations with the pollutants in adult male than in adult female patients both for the pollen season of Ambrosia and the pollen-free season. Furthermore, adults are substantially more sensitive to severe asthma attack than the elderly for the season of total pollen excluding Ambrosia pollen. The joint effect of the chemical and pollen variables is the highest for the asthma ER cases in the pollen season of Ambrosia, basically due to the extra impact of the total pollen excluding Ambrosia pollen and partly due to Ambrosia pollen. A nonparametric regression technique was applied to discriminate between events of ER visit – no ER visit using pollen and chemical pollutants as explaining variables. Based on multiple correlations, the strongest relationships between ER visits and pollutants are observed during the pollen-free season. The elderly group with asthma bronchiale is characterized by weaker relationships between ER visits and pollutants compared to adults. Ratio of the number of correct decisions on the events of ER visit – no ER visit is lowest for the season of total pollen excluding Ambrosia pollen. Otherwise, similar conclusions hold as those received by multiple correlations.
Introduction
Air pollution, as a major and permanently rising hazard for the environment, is associated with large increases in medical expenses, morbidity and is estimated to cause about 800,000 annual premature deaths worldwide [11. Cohen AJ, Anderson HR, Ostro B, Pandey KD, Krzyzanowski M, et al. (2005) The global burden of disease due to outdoor air pollution. J Toxicol Env Health A 68: 1301-1307.]. The prevalence of allergic respiratory diseases has also increased during the last three decades, especially in industrialized countries [22. D'Amato G (2002) Environmental urban factors (air pollution and allergens) and the rising trends in allergic respiratory diseases. Allergy 57: 72: 30-33.-66. Allergic Rhinitis and its Impact on Asthma (ARIA) 2008 update (in collaboration with the World Health Organization, GA(2)LEN and AllerGen). Allergy 8-160.]. Furthermore, an examination of the historical record indicates that the prevalence of allergic rhinitis (AR) and allergic asthma have significantly increased over the past two centuries. Although the reasons for this increase are not fully elucidated, epidemiologic data suggest that certain pollutants produced from the burning of fossil fuels may have played an important role in the prevalence changes [77. Peterson B, Saxon A (1996) Global increases in allergic respiratory disease: The possible role of diesel exhaust particles. Ann Allerg Asthma Im 77: 263-270.,88. Saxon A, Diaz-Sanchez D (2005) Air pollution and allergy: you are what you breathe. Nat Immunol 6: 223-226.]. This increase may be partly explained by changes in environmental factors. Urbanization, the ever increasing automobile traffic with its high levels of vehicle emissions [77. Peterson B, Saxon A (1996) Global increases in allergic respiratory disease: The possible role of diesel exhaust particles. Ann Allerg Asthma Im 77: 263-270.,99. Krämer U, Koch T, Ranft U, Ring J, Behrendt H (2000) Traffic-related air pollution is associated with atopy in children living in urban areas. Epidemiology 11: 64-70.] and the changing lifestyle are linked to the rising frequency of respiratory allergic diseases [1010. D'Amato G, Liccardi G, D'Amato M, Holgate S (2005) Environmental risk factors and allergic bronchial asthma. Clin Exp Allergy 35: 1113-1124.]. Weather conditions can also affect both the biological and chemical air pollutants. There are evidences on the effect of air pollution upon allergens, increasing exposure to the latter, their concentration and/or biological allergenic activity [1111. Pénard-Morand C, Charpin D, Raherison C, Kopfersmitt C, Caillaud D, et al. (2005) Long-term exposure to background air pollution related to respiratory and allergic health in schoolchildren. Clin Exp Allergy 35: 1279-1287.-1313. Just J, Nikasinovic L, Laoudi Y, Grimfeld A (2007) Air pollution and asthma in children. Rev Fr Allergol 47: 207-213. ]. Habitats and levels of pollen are changing in Europe, as a result of cultural factors, more international travel and climate change [1414. Vogl G, Smolik M, Stadler LM, Leitner M, Essl, F, et al. (2008) Modelling the spread of ragweed: Effects of habitat, climate change and diffusion. Eur Phys J-Spec Top 161: 167-173. -1717. Kiss L, Béres I (2006) anthropogenic factors behind the recent population expansion of common ragweed (Ambrosia artemisiifolia L.) in Eastern Europe: is there a correlation with political transitions? J Biogeogr 33: 2156-2157. ]. There is now considerable evidence to suggest that climate change will have, and has already had, impacts on aeroallergens. These include impacts on pollen amount, pollen allergen city, pollen season, plant and pollen distribution, and other plant attributes [1818. Beggs PJ (2004) Impacts of climate change on aeroallergens: past and future. Clin Exp Allergy 34: 1507-1513.-2222. Kaminski U, Glod T (2011) Are there changes in Germany regarding the start of the pollen season, the season length and the pollen concentration of the most important allergenic pollens? Meteorol Z 20: 497-507. ]. Hence, due to the continually increasing air pollution, respiratory diseases are of major concern worldwide.
Air pollution of Hungary is one of the highest in Europe. Around 16,000 annual premature deaths attributable to exposure to ambient PM10 concentrations are estimated in the country [2323. Agren C (2010) Particles killing half a million. Acid News. AirClim. Air Pollution & Climate Secretariat, Sweden 2: 1-5. ,2424. Barrett K, de Leeuw F, Fiala J, Larssen S, Sundvor I, et al. (2008) Health Impacts and Air pollution - An exploration of factors influencing estimates of air pollution impact upon the health of European citizens. ETC/ACC Technical Paper 13. ]. Furthermore, airborne pollen levels are also high. The Carpathian basin, involving Hungary (Figure 1) is considered the most polluted region with airborne ragweed (Ambrosia) pollen in Europe. Ambrosia in Hungary discharges the most pollen of all taxa; the ratio of its pollen release compared to the total pollen release in the late summer period is around 60-71% [2525. Juhász M, Juhász IE (2002) A hazai gyomnövények aeropollinológiai jelent?sége. (Aeropollinological importance of domestic weeds.) Környezeti ártalmak és a légz?rendszer. (Environmental hazards and the respiratory system.)12: 149-160. ]. Highest counts on peak days in Szeged, Southern Hungary, are about one order of magnitude higher than those in other cities of Europe [2626. Makra L, Juhász M, Béczi R, Borsos E (2005) The history and impacts of airborne Ambrosia (Asteraceae) pollen in Hungary. Grana 44: 57-64. ]. The sensitivity of patients to ragweed in Szeged is 83.7% [2727. Kadocsa E, Juhász M (2000) A szénanáthás betegek allergénspektrumának változása a Dél-Alföldön (1990-1998). [Change of allergenic spectrum of hay-fever patients in Southern Great Plain (1990-1998).] Orvosi Hetilap 141: 12617-12620. ]. About 30% of the Hungarian population has some type of allergy, 65% of them have pollen-sensitivity, and at least 60% of this pollen-sensitivity is caused by Ambrosia [2828. Járai-Komlódi M (1998) Ragweed in Hungary. In: Spieksma FThM, editor. Ragweed in Europe. Satellite Symposium Proceedings of 6th International Congress on Aerobiology. Perugia, Italy. Horsholm, Denmark: Alk-Abelló A/S 33-38. ]. The number of patients with registered allergic illnesses has doubled and the number of cases of allergic asthma has become four times higher in Southern Hungary by the late 1990s over the last 40 years [2828. Járai-Komlódi M (1998) Ragweed in Hungary. In: Spieksma FThM, editor. Ragweed in Europe. Satellite Symposium Proceedings of 6th International Congress on Aerobiology. Perugia, Italy. Horsholm, Denmark: Alk-Abelló A/S 33-38. ].
The substantial increase of respiratory diseases in industrialized countries is partly attributable to a combination of chemical air pollutants and allergenic pollen existing in the air of big cities. Several papers have analyzed separately the effects of either pollutants [2929. Chiu HF, Cheng MH, Yang CY (2009) Air Pollution and Hospital Admissions for Pneumonia in a Subtropical City: Taipei, Taiwan. Inhal Toxicol 21: 32-37. ,3030. Alves CA, Scotto MG, Freitas MC (2010) Air Pollution and Emergency Admissions for Cardiorespiratory Diseases in Lisbon (Portugal). Quim Nova 33: 337-344. ] or allergenic pollen [3131. Díaz J, Linares C, Tobías A (2007) Short-term effects of pollen species on hospital admissions in the city of Madrid in terms of specific causes and age. Aerobiologia 23: 231-238. ,3232. Hanigan IC, Johnston FH (2007) Respiratory hospital admissions were associated with ambient airborne pollen in Darwin, Australia, 2004-2005. Clin Exp Allergy 37: 1556-1565.] to hospital admissions of respiratory diseases; however, only very few studies have yet examined the effect of these two kinds of variables together [3333. Andersen ZJ, Wahlin P, Raaschou-Nielsen O, Scheike T, Loft S (2007) Ambient particle source apportionment and daily hospital admissions among children and the elderly in Copenhagen. J Expo Sci Environ Epidemiol 17: 625-636. ,3434. Magas OK, Gunter JT, Regens JL (2007) Ambient air pollution and daily pediatric hospitalizations for asthma. Environ Sci Pollut R 14: 19-23.]. Such papers revealed a significant effect between partly the pollen and chemical compounds and partly health for admitted respiratory patients, and this effect was higher than that detected separately either for the chemical air pollutants or pollen.
The purpose of this study is to analyze the joint effect of biological (pollen) and chemical air pollutants on daily asthma emergency room (ER) visits for both adult and elderly patients during three different seasons in the Szeged region of Southern Hungary. For this aim, factor analysis with special transformation was performed on the air pollutant and asthma ER visit data in order to find out the strength and direction of the association of the air pollutant and asthma variables. Then two procedures based on a nonparametric regression technique were applied to discriminate between the event of asthma ER visit – no asthma ER visit using pollen and chemical air pollutants. The data set applied is unique in the sense that it includes both categories of air pollutants as influencing variables.
Materials and Methods
Location and data
Szeged (46.25°N; 20.10°E) is the largest settlement in South-eastern Hungary (Figure 1). The area is characterized by an extensive flat landscape of the Great Hungarian Plain with an elevation of 79 m above mean sea level. The built-up area covers a region of about 46 km2. The city is the center of the Szeged region with 203,000 inhabitants. In the Köppen system the climate of Szeged is the Ca type (warm temperate climate) with relatively mild and short winters and hot summers [3535. Köppen W (1931) Grundriss Der Klimakunde. Berlin: Walter De Gruyter & Co.]. The pollen content of the air was measured using a 7-day recording "Hirst-type" volumetric trap [3636. Hirst JM (1952) An automatic volumetric spore trap. Ann Appl Biol 39: 257-265. ]. The air sampler is located about 20 m above the ground (Figure 1, lower panel).
Chemical air pollutants were collected in a monitoring station located in the downtown of Szeged at a distance of about 10 m from the busiest main road (Figure 1). They include the daily average mass concentrations of CO (mg.m-3), NO, NO2, SO2, O3 and PM10 (µg⋅m-3) [3030. Alves CA, Scotto MG, Freitas MC (2010) Air Pollution and Emergency Admissions for Cardiorespiratory Diseases in Lisbon (Portugal). Quim Nova 33: 337-344. ]. When selecting biological air pollutants special emphasis is put on Ambrosia due to its above mentioned characteristics in Hungary. Besides ragweed (Ambrosia), further 23 relevant taxa are also taken into account. The taxa with their Latin (English) names are as follows: Acer (maple), Alnus (alder), Artemisia (mugwort), Betula (birch), Cannabis (hemp), Carpinus (hornbeam), Chenopodiaceae (goosefoots), Corylus (hazel), Fraxinus (ash), Juglans (walnut), Morus (mulberry), Pinus (pine), Plantago (plantain), Platanus (plane), Poaceae (grasses), Populus (poplar), Quercus (oak), Rumex (dock), Salix (willow), Taxus (yew), Tilia (linden), Ulmus (elm) and Urtica (nettle). Two pollen variables were formed for our analysis: the daily pollen counts of Ambrosia due to its extremely high concentrations during its short pollen season and the daily total pollen count (the pollen counts of each of the 24 taxa examined) excluding the pollen of Ambrosia.
The daily number of emergency room (ER) visits registered with asthma comes from the Hospital of Chest Diseases, Deszk, Csongrad County, located about 10 km from the monitoring station in Szeged downtown (Figure 1, lower panel).
Age, gender, date of admission and disease type were available for each patient. Asthma ER diseases were categorized using the International Classification of Diseases, Tenth Revision (ICD-10) [3737. World Health Organization (1999) Manual of the international statistical classification of diseases, injuries, and causes of death, 10th revision. World Health Organization, Geneva, Switzerland.], as follows. Allergic asthma (J4500), mixed asthma (J4580) and asthma without specification (J4590) were classified. Allergy was defined in all categories. Generally, three age groups can be considered in the research: young patients (0-14 years), adult patients (15-64 years) and elderly patients (equals to or older than 65 years) because the diagnostic category of asthma may include different syndromes in children, adults and elderly people [3838. Ko FWS, Tam W, Wong TW, Lai CKW, Wong GWK, et al. (2007) Effects of air pollution on asthma hospitalisation rates in different age groups in Hong Kong. Clin Exp Allergy 37: 1312-1319.]. Due to the very small patient number in younger age group, only categories of adults and the elderly people were analysed. For these latter two categories emergency room visits of male and female patients diagnosed with allergic asthma were considered. Altogether 936 ER visits were recorded due to asthma comprising 497 females and 439 males, respectively.
The analysis was performed for a nine-year period 1999-2007 with two pollen variable data sets, namely the daily Ambrosia pollen counts for the pollen season of Ambrosia (July 15 – October 16) and the daily total pollen counts excluding the pollen season of Ambrosia (January 14 – July 14); furthermore, the pollen-free season (October 17 – January 13) were considered. Though the total pollen excluding the pollen season of Ambrosia comprises several allergens, this separation permits studying asthma ER cases that can be originated in the two pollen variables separately as Ambrosia dominates the pollen counts during the main part of its pollen season (Figure 2). Mean daily concentrations of the chemical air pollutants for the three periods are presented in Table 1.
-
 and the mean daily pollen counts of <em>Ambrosia</em> (July 15 – October 16), Szeged, 1999-2007.")
Figure 2:
Mean daily total pollen counts excluding the pollen season of Ambrosia (January 14 – July 14) and the mean daily pollen counts of Ambrosia (July 15 – October 16), Szeged, 1999-2007.
-
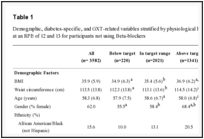
Table 1:
Units: CO: mg⋅m-3; PM10, NO, NO2, O3, SO2: µg⋅m-3.
The pollen season is defined by its start and end dates. For the start (end) of the season we used the first (last) date on which at least 1 pollen grain•m-3 of air is recorded and at least 5 consecutive (preceding) days also show 1 or more pollen grains m-3 [3939. Galán C, Carilanos P, García-Mozo H, Alcázar P, Domínguez-Vilches E (2001) Model for forecasting Olea europaea L. airborne pollen in South-West Andalusia, Spain. Int J Biometeorol 45: 59-63.]. Evidently, the pollen season varies from year to year. Here the longest pollen season observed during the nine-year period was assigned to each year.
Methods
Factor analysis and special transformation
Factor analysis identifies any linear relationships among subsets of examined variables and this helps to reduce the dimensionality of the initial database without substantial loss of information. First, a factor analysis was applied to the initial dataset consisting of 9 variables (8 explanatory variables and 1 resultant variable defined by the number of daily ER visits with asthma) in order to transform the original variables to fewer variables. These new variables (called factors) can be viewed as latent variables explaining the joint behavior of pollutant – asthma ER visit variables. The optimum number of retained factors can be determined by different statistical criteria [4040. Jolliffe IT (1993) Principal component analysis: A beginner's guide - II. Pitfalls, myths and extensions. Weather 48: 246-253.]. The most common and widely accepted one is to specify a least percentage (80%) of the total variance in the original variables that has to be achieved [4141. Liu PWG (2009) Simulation of the daily average PM10 concentrations at Ta-Liao with Box-Jenkins time series models and multivariate analysis. Atmos Environ 43: 2104-2113.]. After performing the factor analysis, a special transformation of the retained factors was made to discover to what degree the above-mentioned explanatory variables affect the resultant variable, and to give a rank of their influence [4242. Jahn W, Vahle H (1968) Die Faktoranalyse und ihre Anwendung. Berlin: Verlag die Wirtschaft ]. When performing factor analysis on the standardized variables factor loadings received are correlation coefficients between the original variables and, after rotation, the coordinate values belonging to the turned axes (namely, factor values). If the resultant variable is strongly correlated with the factor and an influencing variable is highly correlated with the same factor, then the influencing variable is also highly correlated with the resultant variable. Accordingly, it is advisable to combine all the weights of the factors, together with the resultant variable, into one factor. Namely, it is effective to rotate so that only one factor has great load with the resultant variable. The remaining factors are uncorrelated with the resultant variable; that is to say, are of 0 weights [4242. Jahn W, Vahle H (1968) Die Faktoranalyse und ihre Anwendung. Berlin: Verlag die Wirtschaft ]. This latter procedure is called special transformation.
Nonparametric regression
Let Y be an indicator variable which takes values 1 or 0 according to whether ER visit happens or does not happen on a given day. Our goal is to estimate the probability of this ER visit event conditioned on the explaining variables X=(X1,…,Xm). In order to avoid misspecification of the analytical form of the relationship between X and Y a nonparametric regression technique is applied. Because every variable has annual cycle the estimator uses data only from a time interval (time window) of the actual time t. Having a data set (x1,y1),...,(xn,yn)available at instances t1,…,tn we extend the classical Nadaraya-Watson estimator to the time-varying case as ,
Where K(u) is a kernel function evaluated at u, and b is the time window. Thus, the estimated probability is a weighted sum of the indicator values yi accompanied with explaining variables xi. The weights are controlled by the distance via the kernel K, which is chosen here as the Epanechnikov kernel. Specifically, when an xi is close to x the weight of yi is large, while an xi far from x provides a small weight for yi. The so-called bandwidth h plays a similar role as b; it controls the neighborhood of the explaining variable x where xi, and thus yi, are taken into account. The distance mentioned above is the Euclidean with a slight modification. Namely, in order to ensure the same potential importance of every explaining variable, the variables are divided first by their standard deviations. Hence, h has no unit. Rigorous mathematical background of nonparametric regression techniques including ideas to choose the kernel and estimate h and b can be found [4343. Fan J, Yao Q (2005) Nonlinear time series: nonparametric and parametric methods. New York: Springer; ].
The goodness of estimating the ER visit event probabilities conditioned on the explaining variables is measured by R = (1-MSE/V)1/2, where and V is the variance calculated from the indicator data (y1,…,yn). Because R is identical with the multiple correlation for multivariate linear regressions, hereafter the quantity R is labelled multiple correlation.
Usually, a data set available is divided into a learning set and a validation set. The learning set is used to estimate parameters of the statistical model, and this model is then applied to the validation set. A general rule of thumb is to consider the learning set to be around 80% of the total data and the validation set to be the remaining 20%. In this case, however, such a choice of the validation set would cover a small amount of cases. Note that the parameters to be estimated in the nonparametric technique include the time window and bandwidth. Therefore, the validation should include just a proper selection of these parameters. Having K years of data, our validation makes it possible to use K-year validation set with (K-1)-year learning set. Taking the kth year from the entire data set, the parameters are estimated with data omitting the kth year, and estimates for the kth year are then obtained using these parameters. The procedure is applied for k=1, K and thus these estimates for the entire data set are directly validated. A simplification working with the mean of annually varying parameters can be made because the variability of the K number time windows and bandwidths is very small. Section 3.3 will show these validated results.
Results
Optimal time lags
It is reasonable to allow time lags between pollutant concentrations and number of respiratory care. A wide range of candidate time lags are applied for finding the optimal time delay [3838. Ko FWS, Tam W, Wong TW, Lai CKW, Wong GWK, et al. (2007) Effects of air pollution on asthma hospitalisation rates in different age groups in Hong Kong. Clin Exp Allergy 37: 1312-1319.,4444. Nascimento LFC, Pereira LAA, Braga ALF, Modolo MCC, Carvalho JA (2006) Effects of air pollution on children's health in a city in Southeastern Brazil. Revista de Saude Publica 40: 77-82. ], but the literature generally shows delays up to 3 days in patient response to pollution exposure [3030. Alves CA, Scotto MG, Freitas MC (2010) Air Pollution and Emergency Admissions for Cardiorespiratory Diseases in Lisbon (Portugal). Quim Nova 33: 337-344. ,4545. Knight A, Drouin MA, Yang WH, Alexander M, Delcarpio J, et al. (1991) Clinical-evaluation of the efficacy and safety of noberastine, a new H1 antagonist, in seasonal allergic rhinitis - a placebo-controlled, dose-response study. J Allergy Clin Immun 88: 926-934.,4646. World Health Organization (1992. Acute effects on health of smog episodes. WHO Regional Publications, European Series, Geneva: WHO Regional Office for Europe 43: 1-74.].
Our optimal time lags have been selected with the help of the t-test. Namely, a time lag accompanied with the highest absolute t-value was chosen optimal for every explaining variable separately. They vary from zero to five days. There is a tendency with the increasing age for increasing lags. NO2 has the highest number of positive time shifts from air pollutants (typically 5 days for the pollen-free season, furthermore 5 days for the elderly in the pollination season excluding the pollen season of Ambrosia, while generally 2 days for the remaining period and categories) followed by O3 and NO. Within the chemical air pollutants, in agreement with other studies [4747. Orazzo F, Nespoli L, Ito K, Tassinari D, Giardina D, et al. (2009) Air Pollution, Aeroallergens, and Emergency Room Visits for Acute Respiratory Diseases and Gastroenteric Disorders among Young Children in Six Italian Cities. Environ Health Persp 117: 1780-1785.], 0-3 days and 0-4 positive lags are associated with SO2 and CO, respectively. At the same time, for PM10 uniformly 2-day time lags are typical. For the two pollen variables the optimal time lags are the same for both age groups, namely 2 and 5 days for Ambrosia pollen and the remaining pollen, respectively.
Factor analysis with special transformation
After performing a factor analysis for adults, the elderly and the total sensitive subjects (male, female and all patients diagnosed with asthma were considered for each age category) for the three seasons (altogether 3x3x3=27 factor analyses) 6 and 4 factors were retained for each category in the pollen season of Ambrosia and in the pollen-free season, respectively. At the same time, 5 factors were retained for each category in the pollen season of the total pollen excluding Ambrosia pollen. In order to calculate the rank of importance of the explanatory variables for determining the resultant variable, loadings of the retained factors were projected onto Factor 1 for all 27 factor analyses with the special transformation (Table 2a-2c) [4242. Jahn W, Vahle H (1968) Die Faktoranalyse und ihre Anwendung. Berlin: Verlag die Wirtschaft.].
-
Table 2a:
Special transformation. Effect of the explanatory variables on asthma as resultant variable and the rank of importance of the explanatory variables on their factor loadings transformed to Factor 1 for determining the resultant variable; July 15 – October 16 (thresholds of significance: italic: x0.05 = 0.067; bold: x0.01 = 0.088).
-
Table 2b:
Special transformation. Effect of the explanatory variables on asthma as resultant variable and the rank of importance of the Explanatory variables on their factor loadings transformed to Factor 1 for determining the resultant variable; October 17 – January 13 (thresholds of significance: italic: x0.05 = 0.069; bold: x0.01 = 0.091).
-
Table 2c:
Special transformation. Effect of the explanatory variables on asthma as resultant variable and the rank of importance of the Explanatory variables on their factor loadings transformed to Factor 1 for determining the resultant variable; January 14 – July 14 (thresholds of significance: italic: x0.05 = 0.048; bold: x0.01 = 0.064).
For the period July 15 – October 16, adult male patients are more endangered by both chemical air pollutant and pollen related asthma than adult female patients (Table 2a). Both pollen variables are of key importance only for adult male subjects in influencing the asthma ER cases. Total pollen excluding Ambrosia pollen is the most important factor for adult female and total male patients. Furthermore, it is an important component of asthma ER cases for adult male, elderly female and total female subjects. Besides total pollen excluding Ambrosia pollen, subjects are most sensitive to ozone (O3). It is a relevant variable for adult male and female patients, elderly female and elderly all subjects, as well as for total female patients. For adult male patients sulphur dioxide (SO2), for elderly female and total female subjects nitrogen dioxide (NO2) and for elderly total patients carbon monoxide (CO) are the most important variables in influencing asthma ER cases (Table 2a). The total weight of the chemical variables is significantly higher than that of the pollen variables for all age and gender categories. The total weights are around double high for adult male patients for both the chemical and pollen variables compared to the remaining categories. (Table 2a). Both for adult male and female subjects, elderly female patients, as well as the total male and female subjects the total pollen excluding Ambrosia pollen is among the first two most relevant pollutants, while the other most important variable is SO2 and for the remaining four cases it is O3. When summing up the weight of the variables for the individual categories, total pollen excluding Ambrosia pollen and O3 are the most relevant variables, while PM10 and NO are the least important pollutants influencing asthma ER cases. Among pollen variables, total pollen excluding Ambrosia pollen is the most notable pollutant (Table 2a).
For the period October 17 – January 13, the chemical air pollutants show stronger associations with asthma in adult male than in adult female subjects (Table 2b). For adult male subjects, in decreasing order, CO, SO2 and NO2 are significantly correlated with the number of asthma ER cases. For elderly male patients NO2, while for elderly female patients CO and SO2 are the most relevant variables. Furthermore, for total male cases NO2 and SO2, while for total female subjects CO and SO2 are the most important variables. The total weight of the explanatory variables is substantially higher for all the elderly, total male and adult male patients compared to the remaining age and gender categories. Summing up the weights of the pollutants for each category, CO, SO2 and NO2 are the most notable explanatory variables (in decreasing order), while NO and PM10 are the least important pollutants (Table 2b).
For the period January 14 – July 14, asthma ER cases denote notably stronger associations with the chemical variables for adults than for the elderly (Table 2c). In the case of adult male patients O3, while for adult female patients (in decreasing order) SO2, NO, NO2 and PM10 are the most important factors for asthma ER cases. For elderly female and total female subjects CO and O3, as well as SO2, NO2 and NO are the most relevant variables. Asthma is strongly influenced by SO2, NO2, O3 and NO in all adults, by SO2 in all the elderly and by SO2, NO and NO2 in total sensitive patients, all subjects. The chemical variables have substantially higher total weight for each age and gender categories compared to the factor loadings of the total pollen excluding Ambrosia pollen. The role of the pollen variable is practically unimportant for this period. The most sensitive categories indicating by the highest total weights include adult female and adult all patients, as well as total female and total sensitive patients, all subjects. Cumulated weights of the pollutants show that SO2, NO, NO2 and O3 are the most important explanatory variables influencing asthma ER visits. CO and PM10 together with the total pollen excluding Ambrosia pollen can be considered practically negligible, (Table 2c).
Conditional probabilities and events of ER cases
The time window b and the bandwidth h vary from 6 to 30 days and from 1.1 to 4.6 respectively depending on male/gender categories and periods within the year. The pollen season of Ambrosia has the smallest b and h, while the season of the remaining pollen requires the largest ones.
Table 3 summarizes the multiple correlations between the explaining variables and the indicator variable of asthma ER visit – no asthma ER visit, indicating correlations significantly different from zero. Significance levels were determined by a Monte-Carlo simulation experiment as follows. First, indicator variable were randomly reordered. The original observed values were then substituted by these reordered data and the nonparametric regression technique was performed. Finally, the multiple correlation obtained from this procedure was calculated. These steps were repeated 1,000 times, and appropriate quantiles of the empirical probability distribution function of these 1,000 simulated correlations yielded the critical value for checking the null-hypothesis of being the multiple correlation zero. Strongest relationships between ER visit event and pollutants can be observed during the pollen-free season, while no substantial differences between correlations corresponding to the two other periods can be seen. Another important finding is that the elderly group is characterized by weaker relationships between ER visits and pollutants. Finally, slightly higher correlations for females (Table 3) indicate somewhat higher sensitivity of this gender to pollutants at least for ER visits.
-
Table 3:
Multiple correlation between the explanatory variables and the indicator variable defined by the events of emergency visit (italic: significant at 5% level, bold: significant at 1% level). (Thresholds of significance for seasons of Ambrosia pollen, pollen-free season, Total pollen excluding Ambrosia pollen: italic: x0.05 = 0.071, 0.071, 0.050; bold: x0.01 = 0.093, 0.093, 0.066).
Estimation of the probability of the event of ER visit – no ER visit conditioned on the explaining variables makes it possible to create a decision on this event. Namely, when the estimated probability is higher (lower) than p, the answer is yes (no) concerning the event of ER visit – no ER visit, where p is the relative frequency of these visits. Such a decision is called correct when the decision on the event is identical with the observed event. Table 4 shows the ratios of the number of correct decisions to the number of decisions. Although the lowest ratios can be observed for the season of total pollen excluding Ambrosia pollen, no substantial differences appear among seasons. The most prominent finding is that percentages of correct decisions are remarkably higher for ER visits than for no ER visits. The events are thus overrated, which is, however, a smaller problem than the reverse case of overrating the events of no ER visit.
-
Table 4:
Multiple correlation between the explanatory variables and the indicator variable defined by the events of emergency visit (italic: significant at 5% level, bold: significant at 1% level). (Thresholds of significance for seasons of Ambrosia pollen, pollen-free season, Total pollen excluding Ambrosia pollen: italic: x0.05 = 0.071, 0.071, 0.050; bold: x0.01 = 0.093, 0.093, 0.066).
Discussion
The analysis of asthma ER visits due to air pollutant concentrations is a very important issue in public health. The present study analyses a large dataset, namely a nine-year daily database. Our study can be considered specific in the sense that it concurrently includes two categories of influencing variables with 6 chemical and 2 biological (pollen) parameters, furthermore two age categories and gender with asthma ER cases as resultant variable. The above-mentioned associations are examined for three seasons. We know only one study [4848. Chen CH, Xirasagar S, Lin HC (2006) Seasonality in adult asthma admissions, air pollutant levels, and climate: A population-based study. J Asthma 43: 287-292.] that calculated seasonal variations of respiratory admissions in association with levels of PM10, SO2, CO and NO2, and we know only another study [4949. Kassomenos P, Papaloukas C, Petrakis M, Karakitsios S (2008) Assessment and prediction of short term hospital admissions: the case of Athens, Greece. Atmos Environ 42: 7078-7086.] that made an attempt to quantify the impact of different chemical pollutants including meteorological elements on the incidence of AR and asthma. However, pollen has not been studied from this point of view. Two novel procedures are applied in our study: factor analysis with special transformation and a nonparametric regression technique.
Factor analysis with special transformation was applied in order to examine the role of pollen variables and chemical air pollutants in asthma ER visits and to determine the rank of importance of these variables in influencing the above severe asthma attacks. The number of asthma ER visits denotes notably stronger associations with the pollutants in adult male than in adult female patients both for the pollen season of Ambrosia (Table 2a) and the pollen-free season (Table 2b). Furthermore, adults are substantially more sensitive to severe asthma attack than the elderly for the season of total pollen excluding Ambrosia pollen (Table 2c). Asthma in the elderly is frequently underdiagnosed and undertreated [5050. Bauer BA, Reed CE, Yunginger JW, Wollan PC, Silverstein MD (1997) Incidence and outcomes of asthma in the elderly - A population-based study in Rochester, Minnesota. Chest 111: 303-310.-5252. Jones SC, Iverson D, Burns P, Evers U, Caputi, P, et al. (2011) Asthma and ageing: an end user's perspective - the perception and problems with the management of asthma in the elderly. Clin Exp Allergy 41: 471-481.]. The assessment of the disease is complicated by different factors, namely poor perception of symptoms, acceptance of dyspnoe as being "normal" in old age, and reduced expectations of mobility and activity [5353. Global Strategy for Asthma Management and Prevention. 2011.].
The majority of asthmatic patients can control or partly-control the disease with a regular long-term treatment and go to the physician only in the case of emergency or the lack of the effectiveness of the usual therapy. However, for only a fraction of subjects (late admissions of neglected or untreated AR) an inflammation can induce in the lower respiratory tract and hence can lead to asthma. However, asthma can develop independently, as well. Whole pollen grains can provoke the upper respiratory symptoms of AR, while smaller pollen fragments capable of depositing in the lower respiratory tract have been proposed as the trigger for asthma [5454. Miguel AG, Taylor PE, House J, Glovsky MM, Flagan RC (2006) Meteorological influences on respirable fragment release from Chinese elm pollen. Aerosol Sci Tech 40: 690-696.]. Based on the total weights of the individual categories, the joint effect of the chemical and pollen variables is mostly the highest for the asthma ER cases in the period July 15 – October 16 (Table 2a), basically due to the extra impact of the total pollen excluding Ambrosia pollen and partly due to Ambrosia pollen. Key pollutants differ in the two age categories depending on season and sex. For adult male and female patients, the total weight of the chemical variables in the occurrence of asthma ER visits is higher in the pollen season of Ambrosia compared to the pollen-free season (Table 2). Some studies found that exposure to outdoor air pollutants may increase the risk of allergic airway diseases [1111. Pénard-Morand C, Charpin D, Raherison C, Kopfersmitt C, Caillaud D, et al. (2005) Long-term exposure to background air pollution related to respiratory and allergic health in schoolchildren. Clin Exp Allergy 35: 1279-1287.,5555. de Marco R, Poli A, Ferrari M, Accordini S, Giammanco G, et al. (2002) The impact of climate and traffic-related NO2 on the prevalence of asthma and allergic rhinitis in Italy. Clin Exp Allergy 32: 1405-1412. -5858. Koppen G, Bloemen K, Colles A, Nelen V, Desager K, et al. (2011) Exposure to Traffic-Related Air Pollutants in the Perinatal Period of Life in Relation to Respiratory Health in Infancy. Crit Rev Env Sci Tec 41: 2003-2025.]. This may be explained by the fact that air pollutants, especially burning of fossil fuels, can affect allergens. It was found that fossil fuel combustion products may lead to an enhancement of allergic inflammation contributing to the increased prevalence and morbidity of asthma and AR [88. Saxon A, Diaz-Sanchez D (2005) Air pollution and allergy: you are what you breathe. Nat Immunol 6: 223-226.]. Diesel exhaust is able to enhance production of IgE playing an important role in allergy and inducing type 1 hypersensitivity [77. Peterson B, Saxon A (1996) Global increases in allergic respiratory disease: The possible role of diesel exhaust particles. Ann Allerg Asthma Im 77: 263-270.]. NO2 and SO2 not only affect pollen morphology but also change their allergenic potency [5959. Singh AB, Kumar P (2003) Aeroallergens in clinical practice of allergy in India. An overview. Ann Agr Env Med 10: 131-136.]. Seasonal dependence of respiratory diseases is confirmed by [4848. Chen CH, Xirasagar S, Lin HC (2006) Seasonality in adult asthma admissions, air pollutant levels, and climate: A population-based study. J Asthma 43: 287-292.] who found a monsoon climate related seasonal dependence of hospitalization propensity of asthma. Increasing evidences support that climate changes are blamed for the increase in allergic diseases [1919. Williams R (2005) Climate change blamed for rise in hay fever. Nature 434: 1059-1059.].
In the period October 17 – January 13 (Table 2b), a statistically significant negative association was found between asthma ER visits in adult male patients and CO levels; furthermore, a relevant positive association occurred between the above severe asthma attacks in elderly female, elderly all, as well as in total female subjects on one hand and CO levels on the other, respectively. At the same time, for the period July 15 – October 16 (Table 2a) an important positive association was shown between asthma ER cases and CO concentrations in elderly total subjects. CO has been associated with respiratory hospital admissions in several studies. [6060. Freitas MC, Pacheco AMG, Verburg TG, Wolterbeek HT (2010) Effect of particulate matter, atmospheric gases, temperature, and humidity on respiratory and circulatory diseases' trends in Lisbon, Portugal. Environ Monit Assess 162: 113-121.] did not find any statistically significant relationship between respiratory hospital admissions and CO, while [4949. Kassomenos P, Papaloukas C, Petrakis M, Karakitsios S (2008) Assessment and prediction of short term hospital admissions: the case of Athens, Greece. Atmos Environ 42: 7078-7086.,6161. Fusco D, Forastiere F, Michelozzi P, Spadea T, Ostro B, et al. (2001)Air pollution and hospital admissions for respiratory conditions in Rome, Italy. Eur Respir J 17: 1143-1150.-6464. Tramuto F, Cusimano R, Cerame G, Vultaggio M, Calamusa G, et al. (2011) Urban air pollution and emergency room admissions for respiratory symptoms: a case-crossover study in Palermo, Italy. Environ Health 10: 31. ] confirmed the positive role of CO on respiratory health effects. The impact of a long-lasting but low level exposure to CO on respiratory system is therefore still unclear.
In the period January 14 – July 14 (Table 2c) adult female patients indicated a significant positive association with PM10 levels, while for the remaining seasons and categories no important connections were detected. [6161. Fusco D, Forastiere F, Michelozzi P, Spadea T, Ostro B, et al. (2001)Air pollution and hospital admissions for respiratory conditions in Rome, Italy. Eur Respir J 17: 1143-1150.,6565. Katsouyanni K, Zmirou D, Spix C (1996) Short-term effects of urban air pollution on health: a European approach using epidemiologic time series data. The Aphea protocol. J Epidemiol Commun H 5: S12-S18. ] once suggested that gaseous air pollutants, especially CO and NO2, are more important predictors of acute hospitalization for respiratory conditions than particulate matter. In contrast, [4949. Kassomenos P, Papaloukas C, Petrakis M, Karakitsios S (2008) Assessment and prediction of short term hospital admissions: the case of Athens, Greece. Atmos Environ 42: 7078-7086.] found that elevated PM10 levels indicate a dominant role among the main air pollutants. [3030. Alves CA, Scotto MG, Freitas MC (2010) Air Pollution and Emergency Admissions for Cardiorespiratory Diseases in Lisbon (Portugal). Quim Nova 33: 337-344. ,6161. Fusco D, Forastiere F, Michelozzi P, Spadea T, Ostro B, et al. (2001)Air pollution and hospital admissions for respiratory conditions in Rome, Italy. Eur Respir J 17: 1143-1150.] found that the association between particulate matter and health conditions was not significant, while others [3838. Ko FWS, Tam W, Wong TW, Lai CKW, Wong GWK, et al. (2007) Effects of air pollution on asthma hospitalisation rates in different age groups in Hong Kong. Clin Exp Allergy 37: 1312-1319.,6060. Freitas MC, Pacheco AMG, Verburg TG, Wolterbeek HT (2010) Effect of particulate matter, atmospheric gases, temperature, and humidity on respiratory and circulatory diseases' trends in Lisbon, Portugal. Environ Monit Assess 162: 113-121.,6464. Tramuto F, Cusimano R, Cerame G, Vultaggio M, Calamusa G, et al. (2011) Urban air pollution and emergency room admissions for respiratory symptoms: a case-crossover study in Palermo, Italy. Environ Health 10: 31. ,6666. Hajat S, Anderson HR, Atkinson RW, Haines A (2002) Effects of air pollution on general practitioner consultations for upper respiratory diseases in London. Occup Environ Med 59: 294-299.-7171. Zhang F, Wang W, Lv J, Krafft T, Xu J (2011) Time-series studies on air pollution and daily outpatient visits for allergic rhinitis in Beijing, China. Sci Total Environ 409: 2486-2492. ] found that the number of admissions for respiratory causes rose significantly with increased exposure to particulate matter. It should be added that the health impact of particulates is complex as their biological effect can be influenced by the particle size and composition [3030. Alves CA, Scotto MG, Freitas MC (2010) Air Pollution and Emergency Admissions for Cardiorespiratory Diseases in Lisbon (Portugal). Quim Nova 33: 337-344. ].
Asthma ER visits were sensitive to NO only for adult female and adult all subjects, as well as for total female and total sensitive patients all subjects (all are positive associations) in the period January 14 – July 14 (Table 2c). At the same time, NO2 is inversely associated with asthma in elderly female and total female subjects for the period July 15 – October 16 (Table 2a), at the same time it is proportional with adult males, elderly males and total males, as well as with total sensitive subjects all patients for the period October 17 – January 13 (Table 2b). In addition, NO2 is positively associated with asthma ER cases in adult females and adult all subjects, as well as in total females and total sensitive patients all subjects for the period January 14 – July 14 (Table 2c). Although NO and NO2 are thought to increase the predisposition to respiratory diseases, there is still a disparity between the results of different studies. For example, high levels of NO2 partly indicate no significant association with respiratory admissions [3030. Alves CA, Scotto MG, Freitas MC (2010) Air Pollution and Emergency Admissions for Cardiorespiratory Diseases in Lisbon (Portugal). Quim Nova 33: 337-344. ] and partly increase the susceptibility for respiratory diseases [6060. Freitas MC, Pacheco AMG, Verburg TG, Wolterbeek HT (2010) Effect of particulate matter, atmospheric gases, temperature, and humidity on respiratory and circulatory diseases' trends in Lisbon, Portugal. Environ Monit Assess 162: 113-121.]. Other examples of the significant positive impact of NO2 levels on respiratory causes are given [4949. Kassomenos P, Papaloukas C, Petrakis M, Karakitsios S (2008) Assessment and prediction of short term hospital admissions: the case of Athens, Greece. Atmos Environ 42: 7078-7086.,6161. Fusco D, Forastiere F, Michelozzi P, Spadea T, Ostro B, et al. (2001)Air pollution and hospital admissions for respiratory conditions in Rome, Italy. Eur Respir J 17: 1143-1150.,6262. Giovannini M; Sala M, Riva E, Radaelli G (2010) Hospital admissions for respiratory conditions in children and outdoor air pollution in Southwest Milan, Italy. Acta Paediatr 99: 1180-1185.,6464. Tramuto F, Cusimano R, Cerame G, Vultaggio M, Calamusa G, et al. (2011) Urban air pollution and emergency room admissions for respiratory symptoms: a case-crossover study in Palermo, Italy. Environ Health 10: 31. ,7272. Patel MM, Chillrud SN, Correa JC, Hazi Y, Feinberg M, et al. (2010) Traffic-Related Particulate Matter and Acute Respiratory Symptoms among New York City Area Adolescents. Environ Health Persp 118: 1338-1343.,7373. Chiusolo M, Cadum E, Stafoggia M, Galassi C, Berti G, et al. (2011) Short-Term Effects of Nitrogen Dioxide on Mortality and Susceptibility Factors in 10 Italian Cities: The EpiAir Study. Environ Health Persp 119: 1233-1238.,7777. Zhang FY, Li LP, Krafft T, Lv JM, Wang WY, et al. (2011) Study on the Association between Ambient Air Pollution and Daily Cardiovascular and Respiratory Mortality in an Urban District of Beijing. Int J Environ Res Public Health 8: 2109-2123.]. Climate and NO2 dependence of respiratory diseases is also stressed.
Several studies suggest that high concentrations of O3 are harmful to human health and they reveal that there is a positive association between O3 and respiratory hospital admissions [4949. Kassomenos P, Papaloukas C, Petrakis M, Karakitsios S (2008) Assessment and prediction of short term hospital admissions: the case of Athens, Greece. Atmos Environ 42: 7078-7086.,6767. Meng YY, Wilhelm M, Rull RP, English P, Ritz B (2007) Traffic and outdoor air pollution levels near residences and poorly controlled asthma in adults. Ann Allerg Asthma Im; 98: 455-463.,6969. Namdeo A, Tiwary A, Farrow E (2011) Estimation of age-related vulnerability to air pollution: Assessment of respiratory health at local scale. Environ Int 37: 829-837. ,7474. Halonen JI, Lanki T, Tiittanen P, Niemi JV, Loh M, et al. (2010) Ozone and cause-specific cardiorespiratory morbidity and mortality. J Epidemiol Commun H 64: 814-820.-7676. Kim BJ, Kwon JW, Seo JH, Kim HB, Lee SY, et al. (2011) Association of ozone exposure with asthma, allergic rhinitis, and allergic sensitization. Ann Allerg Asthma Im 107: 214-219.]. Furthermore, the lowest ozone concentrations in the winter months were found to involve an apparent decrease in consultations for upper respiratory tract diseases in London [6666. Hajat S, Anderson HR, Atkinson RW, Haines A (2002) Effects of air pollution on general practitioner consultations for upper respiratory diseases in London. Occup Environ Med 59: 294-299.]. In contrast, we observed a statistically significant negative effect of ozone except for elderly female subjects in the period January 14 – July 14 (Table 2c). Hence we received two kinds of associations between ozone concentrations and asthma ER cases. The interpretation of these findings is not straightforward. However, it has been found that O3 and NO2, with or without SO2, can enhance the airway allergic response in susceptible individuals such as those with asthma and rhinitis. Investigating cellular and sub-cellular mechanisms suggest that pollutants are likely to influence the actions and interactions of a variety of cells, and lead to the synthesis of pro-inflammatory mediators that modulate the activity and functions of inflammatory cells [7878. Davies RJ, Rusznak C, Devalia JL (1998) Why is allergy increasing? Environmental factors. Clin Exp Allergy 28: 8-14.]. As there is no evidence that low levels of ozone are harmful, this association seems paradoxical. The phenomenon called Paradoxical Ozone Association, i.e. POA [7979. Joseph PM (2007) Paradoxical ozone associations could be due to methyl nitrite from combustion of methyl ethers or esters in engine fuels. Environ Int 33: 1090-1106.] could be due to methyl nitrite from some combustion of methyl ethers or esters in engine fuels. Methyl nitrite is known to be highly toxic, and closely related alkyl nitrites are known to induce respiratory sensitivity in humans [8080. Joseph PM, Weiner MG (2002) Visits to physicians after the oxygenation of gasoline in Philadelphia. Arch Environ Health 57: 137-154.]. Since sunlight is essential for ozone formation by photochemical oxidation, a probable explanation for POA is the existence of this nitrite pollutant that is rapidly destroyed by solar radiation. Hence, methyl nitrite is negatively correlated with O3. Since sunlight has the opposite effect on methyl nitrite, one would expect the most acute methyl nitrite effect in winter [7979. Joseph PM (2007) Paradoxical ozone associations could be due to methyl nitrite from combustion of methyl ethers or esters in engine fuels. Environ Int 33: 1090-1106.]. A negative association between O3 levels and asthma ER visits in the summer period (July 15 – October 16) (Table 2a) can be explained by the fact that our monitoring station is situated at a junction with a high traffic volume.
We found significant positive associations between SO2 levels and asthma ER visits in adult male patients for the period July 15 – October 16 (Table 2a), furthermore in adult males and adult all subjects, as well as in elderly females and in all three categories of total sensitive patients for the period October 17 – January 13 (Table 2b). Besides, relevant proportional associations were found between SO2 concentrations and severe asthma cases in adult female and adult total patients, in elderly total subjects, as well as in total females and total sensitive patients all subjects for the period January 14 – July 14 (Table 2c). Previous findings concerning the role of SO2 seem inconsistent. This pollutant was not significantly associated with respiratory diseases by [3838. Ko FWS, Tam W, Wong TW, Lai CKW, Wong GWK, et al. (2007) Effects of air pollution on asthma hospitalisation rates in different age groups in Hong Kong. Clin Exp Allergy 37: 1312-1319.,6565. Katsouyanni K, Zmirou D, Spix C (1996) Short-term effects of urban air pollution on health: a European approach using epidemiologic time series data. The Aphea protocol. J Epidemiol Commun H 5: S12-S18. ], but other studies reported positive relationships [3030. Alves CA, Scotto MG, Freitas MC (2010) Air Pollution and Emergency Admissions for Cardiorespiratory Diseases in Lisbon (Portugal). Quim Nova 33: 337-344. ,6565. Katsouyanni K, Zmirou D, Spix C (1996) Short-term effects of urban air pollution on health: a European approach using epidemiologic time series data. The Aphea protocol. J Epidemiol Commun H 5: S12-S18. ,6666. Hajat S, Anderson HR, Atkinson RW, Haines A (2002) Effects of air pollution on general practitioner consultations for upper respiratory diseases in London. Occup Environ Med 59: 294-299.,7777. Zhang FY, Li LP, Krafft T, Lv JM, Wang WY, et al. (2011) Study on the Association between Ambient Air Pollution and Daily Cardiovascular and Respiratory Mortality in an Urban District of Beijing. Int J Environ Res Public Health 8: 2109-2123.].
Ambrosia pollen levels have a significant positive association only with adult male patients (Table 2a). Total pollen excluding Ambrosia pollen is in relevant inverse association with adult males and total males, while it is positively associated with adult females, elderly females and total females for the period July 15 – October 16 (Table 2a). In the period January 14 – July 14, total pollen excluding Ambrosia pollen indicates very low weights for each category involving an indifferent role in severe asthma attacks (Table 2c). Results received for the period July 15 – October 16 (Table 2a) indicating significant positive associations between pollen levels and the patient numbers, are similar to those found [7777. Zhang FY, Li LP, Krafft T, Lv JM, Wang WY, et al. (2011) Study on the Association between Ambient Air Pollution and Daily Cardiovascular and Respiratory Mortality in an Urban District of Beijing. Int J Environ Res Public Health 8: 2109-2123.,8181. Carracedo-Martinez E, Sanchez C, Taracido M, Saez M, Jato V, et al. (2008) Effect of short-term exposure to air pollution and pollen on medical emergency calls: a case-crossover study in Spain. Allergy 63: 347-353.,8282. Erkara I, Cingi C, Ayranci U, Gurbuz K, Pehlivan S, et al. (2009) Skin prick test reactivity in allergic rhinitis patients to airborne pollens. Environ Monit Assess 151: 401-412.].
The results obtained for the elderly, especially concerning the chemical variables for the period January 14 – July 14 (Table 2c) and the pollen variables for the period July 15 – October 16 (Table 2a) differ substantially from those received for adults for the above periods. Some of the elderly habits, as social factors, tend to underestimate chronic diseases and consider them as a natural attendant of age. Hence, the elderly often do not turn to physician and seek medical treatment in time [8383. Johnson ML (2005) editor. The Cambridge Handbook of Age and Ageing, Cambridge: Cambridge University Press;].
Multiple correlations between the explaining variables and the indicator variables defined by events of ER visit – no ER visit (Table 3) show the strongest relationships during the pollen-free season. Another important finding is that the elderly group is characterized by substantially weaker relationships between ER patients and pollutants.
Ratio of the number of correct decisions to the number of decisions on events of ER visit – no ER visit is the lowest for the pollen season of all taxa excluding Ambrosia. Again, much weaker results appear for the elderly group. Percentages in Table 4 can be compared to some reference percentages as follows. If we omit the information of the explaining variables on daily ER events and hence decisions are made with a random choice of these events, the expected percentages of the event of ER visit equal to the relative frequencies p of days with emergency visits. Thus, Table 4 shows that decision on events of ER visit provides useful information but with a price of underestimating the frequency of the event of no ER visit.
Conclusion
Results received by the two procedures are partly different, due to the fact that factor analysis with special transformation describes only linear associations, while nonparametric regression techniques can handle nonlinear relationships. Now we emphasize the joint characteristics obtained by the two methodologies. Namely, the number of asthma ER visits indicates stronger associations with the pollutants in adult male than in adult female patients for the pollen season of Ambrosia. At the same time, ER visits due to asthma are more frequent in adult females, than in adult males and are substantially less prevalent in all the elderly patients than in all adults for the season of total pollen excluding Ambrosia pollen. Based on all three seasons, asthma ER visits are remarkably more frequent in total female patients than in total male subjects. Note that relevant associations may differ per different seasons, but a common finding is that the elderly group is characterized by substantially weaker relationships between ER asthma visits and pollutants.
Anyone suffering from asthma needs a warning sign before symptoms set in. Taking precautions can help alleviate the discomfort caused by allergic reactions to pollutants. For instance, we have developed and applied different statistical models to predict Ambrosia pollen counts for 1-7 days ahead for Szeged distinguishing between rainy and non-rainy days using the preceding day values of 8 meteorological parameters and preceding day pollen concentration [8484. Makra L, Matyasovszky I (2011) Assessment of the Daily Ragweed Pollen Concentration with Previous-Day Meteorological Variables Using Regression and Quantile Regression Analysis for Szeged, Hungary. Aerobiologia 27: 247-259.]. Our aim is to cooperate with the local and national media in order to inform the concerned subjects about the forthcoming high pollen levels. A future plan is to develop a combined air quality forecast several days ahead including both the Ambrosia pollen and the main chemical air pollutants.
Acknowledgments
The authors would like to thank Gábor Motika (Environmental Conservancy Inspectorate, Szeged, Hungary) for providing chemical air pollutant data of Szeged, Miklós Juhász (University of Szeged) for providing pollen data of Szeged, Zoltán Sümeghy (University of Szeged) for the digital mapping in Figure 1 and Zoltán Csépe (University of Szeged) for useful suggestions. The European Union and the European Social Fund provided financial support for the project under the grant agreement no. TAMOP 4.2.1/B-09/1/KMR-2010-0003 and TAMOP-4.2.1/B-09/1/KONV-2010-0005.
- Cohen AJ, Anderson HR, Ostro B, Pandey KD, Krzyzanowski M, et al. (2005) The global burden of disease due to outdoor air pollution. J Toxicol Env Health A 68: 1301-1307.
- D'Amato G (2002) Environmental urban factors (air pollution and allergens) and the rising trends in allergic respiratory diseases. Allergy 57: 72: 30-33.
- Asher MI, Montefort S, Bjorkstén B, Lai CK, Strachan DP, et al. (2006) worldwide time trends in the prevalence of symptoms of asthma, allergic rhinoconjunctivitis, and eczema in childhood: ISAAC Phases One and Three repeat multicountry cross-sectional surveys. Lancet 368: 733-743.
- Lundback B (1998) Epidemiology of rhinitis and asthma. Clin Exp Allergy 28: 3-10.
- ECRHS (1996) Variations in the prevalence of respiratory symptoms, self-reported asthma attacks, and use of asthma medication in the European Community Respiratory Health Survey (ECRHS). Eur Respir J 9: 687-695.
- Allergic Rhinitis and its Impact on Asthma (ARIA) 2008 update (in collaboration with the World Health Organization, GA(2)LEN and AllerGen). Allergy 8-160.
- Peterson B, Saxon A (1996) Global increases in allergic respiratory disease: The possible role of diesel exhaust particles. Ann Allerg Asthma Im 77: 263-270.
- Saxon A, Diaz-Sanchez D (2005) Air pollution and allergy: you are what you breathe. Nat Immunol 6: 223-226.
- Krämer U, Koch T, Ranft U, Ring J, Behrendt H (2000) Traffic-related air pollution is associated with atopy in children living in urban areas. Epidemiology 11: 64-70.
- D'Amato G, Liccardi G, D'Amato M, Holgate S (2005) Environmental risk factors and allergic bronchial asthma. Clin Exp Allergy 35: 1113-1124.
- Pénard-Morand C, Charpin D, Raherison C, Kopfersmitt C, Caillaud D, et al. (2005) Long-term exposure to background air pollution related to respiratory and allergic health in schoolchildren. Clin Exp Allergy 35: 1279-1287.
- Bartra J, Mullol J, del Cuvillo A, Davila I, Ferrer M, Jauregui I, et al. (2007) Air pollution and allergens. J Invest Allerg Clin 17: 3-8.
- Just J, Nikasinovic L, Laoudi Y, Grimfeld A (2007) Air pollution and asthma in children. Rev Fr Allergol 47: 207-213.
- Vogl G, Smolik M, Stadler LM, Leitner M, Essl, F, et al. (2008) Modelling the spread of ragweed: Effects of habitat, climate change and diffusion. Eur Phys J-Spec Top 161: 167-173.
- Ariano, R, Canonica, GW, Passalacqua, G (2010) Possible role of climate changes in variations in pollen seasons and allergic sensitizations during 27 years. Ann Allerg Asthma Im104: 215-222.
- Cecchi L, D'Amato G, Ayres JG, Galán C, Forastiere F, et al. (2010) Projections of the effects of climate change on allergic asthma: the contribution of aerobiology. Allergy 65: 1073-1081.
- Kiss L, Béres I (2006) anthropogenic factors behind the recent population expansion of common ragweed (Ambrosia artemisiifolia L.) in Eastern Europe: is there a correlation with political transitions? J Biogeogr 33: 2156-2157.
- Beggs PJ (2004) Impacts of climate change on aeroallergens: past and future. Clin Exp Allergy 34: 1507-1513.
- Williams R (2005) Climate change blamed for rise in hay fever. Nature 434: 1059-1059.
- D'Amato G, Cecchi L, Bonini S, Nunes C, Annesi-Maesano I, et al. (2007) Allergenic pollen and pollen allergy in Europe. Allergy 62: 976-990.
- Reid CE, Gamble JL (2009) Aeroallergens, Allergic Disease, and Climate Change: Impacts and Adaptation. Ecohealth 6: 458-470.
- Kaminski U, Glod T (2011) Are there changes in Germany regarding the start of the pollen season, the season length and the pollen concentration of the most important allergenic pollens? Meteorol Z 20: 497-507.
- Agren C (2010) Particles killing half a million. Acid News. AirClim. Air Pollution & Climate Secretariat, Sweden 2: 1-5.
- Barrett K, de Leeuw F, Fiala J, Larssen S, Sundvor I, et al. (2008) Health Impacts and Air pollution - An exploration of factors influencing estimates of air pollution impact upon the health of European citizens. ETC/ACC Technical Paper 13.
- Juhász M, Juhász IE (2002) A hazai gyomnövények aeropollinológiai jelent?sége. (Aeropollinological importance of domestic weeds.) Környezeti ártalmak és a légz?rendszer. (Environmental hazards and the respiratory system.)12: 149-160.
- Makra L, Juhász M, Béczi R, Borsos E (2005) The history and impacts of airborne Ambrosia (Asteraceae) pollen in Hungary. Grana 44: 57-64.
- Kadocsa E, Juhász M (2000) A szénanáthás betegek allergénspektrumának változása a Dél-Alföldön (1990-1998). [Change of allergenic spectrum of hay-fever patients in Southern Great Plain (1990-1998).] Orvosi Hetilap 141: 12617-12620.
- Járai-Komlódi M (1998) Ragweed in Hungary. In: Spieksma FThM, editor. Ragweed in Europe. Satellite Symposium Proceedings of 6th International Congress on Aerobiology. Perugia, Italy. Horsholm, Denmark: Alk-Abelló A/S 33-38.
- Chiu HF, Cheng MH, Yang CY (2009) Air Pollution and Hospital Admissions for Pneumonia in a Subtropical City: Taipei, Taiwan. Inhal Toxicol 21: 32-37.
- Alves CA, Scotto MG, Freitas MC (2010) Air Pollution and Emergency Admissions for Cardiorespiratory Diseases in Lisbon (Portugal). Quim Nova 33: 337-344.
- Díaz J, Linares C, Tobías A (2007) Short-term effects of pollen species on hospital admissions in the city of Madrid in terms of specific causes and age. Aerobiologia 23: 231-238.
- Hanigan IC, Johnston FH (2007) Respiratory hospital admissions were associated with ambient airborne pollen in Darwin, Australia, 2004-2005. Clin Exp Allergy 37: 1556-1565.
- Andersen ZJ, Wahlin P, Raaschou-Nielsen O, Scheike T, Loft S (2007) Ambient particle source apportionment and daily hospital admissions among children and the elderly in Copenhagen. J Expo Sci Environ Epidemiol 17: 625-636.
- Magas OK, Gunter JT, Regens JL (2007) Ambient air pollution and daily pediatric hospitalizations for asthma. Environ Sci Pollut R 14: 19-23.
- Köppen W (1931) Grundriss Der Klimakunde. Berlin: Walter De Gruyter & Co.
- Hirst JM (1952) An automatic volumetric spore trap. Ann Appl Biol 39: 257-265.
- World Health Organization (1999) Manual of the international statistical classification of diseases, injuries, and causes of death, 10th revision. World Health Organization, Geneva, Switzerland;
- Ko FWS, Tam W, Wong TW, Lai CKW, Wong GWK, et al. (2007) Effects of air pollution on asthma hospitalisation rates in different age groups in Hong Kong. Clin Exp Allergy 37: 1312-1319.
- Galán C, Carilanos P, García-Mozo H, Alcázar P, Domínguez-Vilches E (2001) Model for forecasting Olea europaea L. airborne pollen in South-West Andalusia, Spain. Int J Biometeorol 45: 59-63.
- Jolliffe IT (1993) Principal component analysis: A beginner's guide - II. Pitfalls, myths and extensions. Weather 48: 246-253.
- Liu PWG (2009) Simulation of the daily average PM10 concentrations at Ta-Liao with Box-Jenkins time series models and multivariate analysis. Atmos Environ 43: 2104-2113.
- Jahn W, Vahle H (1968) Die Faktoranalyse und ihre Anwendung. Berlin: Verlag die Wirtschaft
- Fan J, Yao Q (2005) Nonlinear time series: nonparametric and parametric methods. New York: Springer;
- Nascimento LFC, Pereira LAA, Braga ALF, Modolo MCC, Carvalho JA (2006) Effects of air pollution on children's health in a city in Southeastern Brazil. Revista de Saude Publica 40: 77-82.
- Knight A, Drouin MA, Yang WH, Alexander M, Delcarpio J, et al. (1991) Clinical-evaluation of the efficacy and safety of noberastine, a new H1 antagonist, in seasonal allergic rhinitis - a placebo-controlled, dose-response study. J Allergy Clin Immun 88: 926-934.
- World Health Organization (1992. Acute effects on health of smog episodes. WHO Regional Publications, European Series, Geneva: WHO Regional Office for Europe 43: 1-74.
- Orazzo F, Nespoli L, Ito K, Tassinari D, Giardina D, et al. (2009) Air Pollution, Aeroallergens, and Emergency Room Visits for Acute Respiratory Diseases and Gastroenteric Disorders among Young Children in Six Italian Cities. Environ Health Persp 117: 1780-1785.
- Chen CH, Xirasagar S, Lin HC (2006) Seasonality in adult asthma admissions, air pollutant levels, and climate: A population-based study. J Asthma 43: 287-292.
- Kassomenos P, Papaloukas C, Petrakis M, Karakitsios S (2008) Assessment and prediction of short term hospital admissions: the case of Athens, Greece. Atmos Environ 42: 7078-7086.
- Bauer BA, Reed CE, Yunginger JW, Wollan PC, Silverstein MD (1997) Incidence and outcomes of asthma in the elderly - A population-based study in Rochester, Minnesota. Chest 111: 303-310.
- Mohangoo AD, van der Linden MW, Schellevis FG, Raat H (2006) Prevalence estimates of asthma or COPD from a health interview survey and from general practitioner registration: what's the difference? Eur J Public Health 16: 101-105.
- Jones SC, Iverson D, Burns P, Evers U, Caputi, P, et al. (2011) Asthma and ageing: an end user's perspective - the perception and problems with the management of asthma in the elderly. Clin Exp Allergy 41: 471-481.
- Global Strategy for Asthma Management and Prevention. 2011;
- Miguel AG, Taylor PE, House J, Glovsky MM, Flagan RC (2006) Meteorological influences on respirable fragment release from Chinese elm pollen. Aerosol Sci Tech 40: 690-696.
- de Marco R, Poli A, Ferrari M, Accordini S, Giammanco G, et al. (2002) The impact of climate and traffic-related NO2 on the prevalence of asthma and allergic rhinitis in Italy. Clin Exp Allergy 32: 1405-1412.
- Yu JH, Lue KH, Lu KH, Sun HL, Lin YH, et al. (2005) The relationship of air pollution to the prevalence of allergic diseases in Taichung and Chu-Shan in 2002. J Microbiol Immunol Infect 38: 123-126.
- Kelly FJ, Fussell JC (2011) Air pollution and airway disease. Clin Exp Allergy 41: 1059-1071.
- Koppen G, Bloemen K, Colles A, Nelen V, Desager K, et al. (2011) Exposure to Traffic-Related Air Pollutants in the Perinatal Period of Life in Relation to Respiratory Health in Infancy. Crit Rev Env Sci Tec 41: 2003-2025.
- Singh AB, Kumar P (2003) Aeroallergens in clinical practice of allergy in India. An overview. Ann Agr Env Med 10: 131-136.
- Freitas MC, Pacheco AMG, Verburg TG, Wolterbeek HT (2010) Effect of particulate matter, atmospheric gases, temperature, and humidity on respiratory and circulatory diseases' trends in Lisbon, Portugal. Environ Monit Assess 162: 113-121.
- Fusco D, Forastiere F, Michelozzi P, Spadea T, Ostro B, et al. (2001)Air pollution and hospital admissions for respiratory conditions in Rome, Italy. Eur Respir J 17: 1143-1150.
- Giovannini M; Sala M, Riva E, Radaelli G (2010) Hospital admissions for respiratory conditions in children and outdoor air pollution in Southwest Milan, Italy. Acta Paediatr 99: 1180-1185.
- Darrow LA, Klein M, Sarnat JA, Mulholland JA, Strickland MJ, et al. (2011) The use of alternative pollutant metrics in time-series studies of ambient air pollution and respiratory emergency department visits. J Expo Sci Env Epid 21: 10-19.
- Tramuto F, Cusimano R, Cerame G, Vultaggio M, Calamusa G, et al. (2011) Urban air pollution and emergency room admissions for respiratory symptoms: a case-crossover study in Palermo, Italy. Environ Health 10: 31.
- Katsouyanni K, Zmirou D, Spix C (1996) Short-term effects of urban air pollution on health: a European approach using epidemiologic time series data. The Aphea protocol. J Epidemiol Commun H 5: S12-S18.
- Hajat S, Anderson HR, Atkinson RW, Haines A (2002) Effects of air pollution on general practitioner consultations for upper respiratory diseases in London. Occup Environ Med 59: 294-299.
- Meng YY, Wilhelm M, Rull RP, English P, Ritz B (2007) Traffic and outdoor air pollution levels near residences and poorly controlled asthma in adults. Ann Allerg Asthma Im; 98: 455-463.
- Chung KAF, Zhang JF, Zhong NS (2011) Outdoor air pollution and respiratory health in Asia. Respirology 16: 1023-1026.
- Namdeo A, Tiwary A, Farrow E (2011) Estimation of age-related vulnerability to air pollution: Assessment of respiratory health at local scale. Environ Int 37: 829-837.
- Richardson EA, Pearce J, Kingham S (2011) Is particulate air pollution associated with health and health inequalities in New Zealand? Health & Place 17: 1137-1143.
- Zhang F, Wang W, Lv J, Krafft T, Xu J (2011) Time-series studies on air pollution and daily outpatient visits for allergic rhinitis in Beijing, China. Sci Total Environ 409: 2486-2492.
- Patel MM, Chillrud SN, Correa JC, Hazi Y, Feinberg M, et al. (2010) Traffic-Related Particulate Matter and Acute Respiratory Symptoms among New York City Area Adolescents. Environ Health Persp 118: 1338-1343.
- Chiusolo M, Cadum E, Stafoggia M, Galassi C, Berti G, et al. (2011) Short-Term Effects of Nitrogen Dioxide on Mortality and Susceptibility Factors in 10 Italian Cities: The EpiAir Study. Environ Health Persp 119: 1233-1238.
- Halonen JI, Lanki T, Tiittanen P, Niemi JV, Loh M, et al. (2010) Ozone and cause-specific cardiorespiratory morbidity and mortality. J Epidemiol Commun H 64: 814-820.
- Ji M, Cohan DS, Bell ML (2011) Meta-analysis of the association between short-term exposure to ambient ozone and respiratory hospital admissions. Environ Res Lett 6.
- Kim BJ, Kwon JW, Seo JH, Kim HB, Lee SY, et al. (2011) Association of ozone exposure with asthma, allergic rhinitis, and allergic sensitization. Ann Allerg Asthma Im 107: 214-219.
- Zhang FY, Li LP, Krafft T, Lv JM, Wang WY, et al. (2011) Study on the Association between Ambient Air Pollution and Daily Cardiovascular and Respiratory Mortality in an Urban District of Beijing. Int J Environ Res Public Health 8: 2109-2123.
- Davies RJ, Rusznak C, Devalia JL (1998) Why is allergy increasing? Environmental factors. Clin Exp Allergy 28: 8-14.
- Joseph PM (2007) Paradoxical ozone associations could be due to methyl nitrite from combustion of methyl ethers or esters in engine fuels. Environ Int 33: 1090-1106.
- Joseph PM, Weiner MG (2002) Visits to physicians after the oxygenation of gasoline in Philadelphia. Arch Environ Health 57: 137-154.
- Carracedo-Martinez E, Sanchez C, Taracido M, Saez M, Jato V, et al. (2008) Effect of short-term exposure to air pollution and pollen on medical emergency calls: a case-crossover study in Spain. Allergy 63: 347-353.
- Erkara I, Cingi C, Ayranci U, Gurbuz K, Pehlivan S, et al. (2009) Skin prick test reactivity in allergic rhinitis patients to airborne pollens. Environ Monit Assess 151: 401-412.
- Johnson ML (2005) editor. The Cambridge Handbook of Age and Ageing, Cambridge: Cambridge University Press;
- Makra L, Matyasovszky I (2011) Assessment of the Daily Ragweed Pollen Concentration with Previous-Day Meteorological Variables Using Regression and Quantile Regression Analysis for Szeged, Hungary. Aerobiologia 27: 247-259.


Figure 1:
Location of Europe with Hungary (upper panel) and the urban web of Szeged with the positions of the data sources (lower panel). 1: air quality and meteorological monitoring station; 2: aerobiological station; 3: Hospital of Chest Diseases in Deszk.
Figure 1: Location of Europe with Hungary (upper panel) and the urban web of Szeged with the positions of the data sources (lower panel). 1: air quality and meteorological monitoring station; 2: aerobiological station; 3: Hospital of Chest Diseases in Deszk.